Participatory Modelling Journalism


An argument and guide for the application of participatory modelling to journalistic coverage of complex situations.

An increasing share of ‘problems’ our society encounters these days are characterized by disagreement on both the factual foundations and opinions among those involved. Public debates are leading towards this structure within an increasingly complex and polarized social environment. In a post-truth culture, examples can be found in urban politics, climate change, and economic debates. Scientific research that deals with messy problems and respective solutions, terms these as messy problems. One of the methods, proposes in science as a method to handle messy problems, is participatory modeling. Participatory modeling journalism then represents an argument to apply this particular method in journalism. We address the application to both journalistic research and story-telling. Participatory modeling allows us to structure, guide, and holistically perceive messy problems. It focuses on an integration of diverse and relevant perspectives and knowledge pools, and a systematic, problem-oriented understanding of the subject. Based on previous experience working within participatory modeling research projects, and first insights into the field of journalism, I perceive a high-level fit of method and the journalistic practices and goals.


Jump to...


Following this argument for participatory modeling journalism, I exemplify the method of a case study of water scarcity along a river. An upstream community constructs a dam to benefit from hydropower generation. Consequently, a community downstream is in fear of resulting water scarcity as the dam would reduce water supply. Disagreement on the factual foundations, how will the dam impact water flow, and differences in opinions, characterize the resulting messy problem. This scenario is taken from the DAFNE research project and further described in the box below.

Water is probably the most crucial and scarce natural resource in wide parts of Eastern Africa. Here, our case study is found along the Kenyan-Ethiopian border: the Omo-Turkana Basin. The national border marks the transition of the Omo River, coming from the Ethiopian highlands, into Lake Turkana. As the primary tributary to Lake Turkana, the Omo is the indispensable source of freshwater inflow as it sustains the ecosystem and secures human livelihoods. Since a long time place to various forms of traditional livelihood, it has more recently become a place of confrontation with the physical realities of modernization. As scribed, the messy problem relates to the distribution and access to water resources of the Omo River. Between both sides, those representing the traditional livelihoods and those representing modernization aspirations, neither facts nor opinions converge.
To sustain and expand their current economic growth, the Ethiopian state, its economy and foreign investors discovered the potential for hydropower along the Omo River around the turn of the century. The yet largest, most discussed, and controversial hydropower project on the Omo, Gibe 3, finished construction recently. A related debate on consequences is ongoing since beginning of constructions in 2006.
Consent among both sides is limited to a rough statement that the dam operation alters the flow of the Omo. Whether the consequences are negative, positive or not significant on the downstream ecosystem polarizes the involved actors. Within the prioritization of modernization over traditional forms of livelihoods, and the opposing perspective, opinions consequently diverge.
This particular story came to my mind when working in the DAFNE research project for that the Omo-Turkana-Basin is one of the project's key case studies. In 2018, I visited both countries to exercise a participatory modelling process on the issue of sustainable water resource management. In interviews with representatives of ministries, NGOs and researchers, I was confronted with a wide spectrum of different perspectives and knowledge pools. On the one hand, Kenyan ministerial- and NGO representatives pointed out the dangers to the ecosystem and connected livelihoods. Reported and communicated by multiple studies and international media, the reduced flow of water endangers livelihoods in the lower parts of the Omo and Lake Turkana. Here, 500.000 people are assessed to be dependent on this ecosystem (Horne and Mousseau, 2011). On the other hand, the majority of Ethiopian stakeholders stressed the importance of the dam and connected commercial agricultural projects in the state's modernization efforts. The altered downstream flow and reported consequent dangers are instead replaced by hopes to manage the downstream flow even more efficiently to distribute the water also in the dry season.
Overall, the conducted research pointed out far more nuances within this problem structure. For the exemplary purpose, the situation can thus be summarized as a disagreement between two sides on the distribution of the water resources.

The core of the method: Causal Loop Diagrams

Causal loop diagrams (CLDs) are the heart of participatory modeling. They function and allow to structure messy problems and their complex causal structures within a holistic perspective. In essence, these are based on a network-structure indicating causal relationships between variables. In participatory modeling processes, CLDs are used to explicitly map the perspective of stakeholders. Such a mapping allows to analyze problem structures and dynamics. Variables represent measurable concepts or states e.g. temperature, crime levels, or ice cream sales. The directed links between them indicate causal relationships. These can be positive or negative. There is a positive causal relation between temperature and ice cream sales: as temperature increases, ice cream sales increase. A negative causal relationship can be found within the case study: reduced downstream discharge increases levels of soil erosion. It is these intuitive and simple structures, that enable us to reflect on high levels of complexity in causal structures. In reality, a CLD often contains more than 15 or 20 variables with various links. Communicating, discussing, and analyzing such complexity within text-based approaches would be prone to fail. If you are curious about the process to build up a CLD within an interview or individual-process, click the box below. In a later section, I discuss the ability of CLDs within journalistic, digital storytelling.

Responsive image

Define the problem

CLDs are constructed around a key variable (for many problem-oriented applications) representing the 'problem' variable. For the case-study e.g. water scarcity, poverty, etc. are potential problem variables. The overall CLD then makes explicit the causal embedding of this variable in relation to its causes and consequences. For the Omo-Turkana case-study, stakeholders were asked to bring to problem variable up themselves. For other cases, the problem variable can be pre-defined. Following an example problem-variable brought up, we construct an exemplary CLD around poverty as the central variable.


Causes

Next, variables are added that impact (cause) the central variable's state. While in a first instance directly causing variables are integrated, one might also think about indirect causes (those causing the direct causes). In our case, food security might be a key driver of poverty. Further, land erosion was commonly named to impact food security. Asking for causes and consequences, the importance of asking neutral questions becomes salient in order not to influence the thought process of the interviewee.


Consequences

The consequences of the central variables are drawn to focus on the third step. The process to integrate consequences is fairly similar to the causes. First asking for direct consequences, while later adding indirect consequences and their connections. Within the example, both water accessibility and population growth are be connected to poverty. Concerning indirect consequences, the link between water accessibility and population growth is pointed out.


Feedbacks

With causes and consequences established, their connection gains focus. The interviewee is asked to draw connections between consequences and causes. These are crucial for the overall structure as they introduce either balancing or polarizing dynamics. Such connections, where a plural number of elements is connected in a way that the output will be routed back as input is considered a feedback loop. Often, these fall under a bias of human perception as the human brain tends to ignore the impact of feedback dynamics by rather focusing on linear chains of causal events. E.g. the connection between lower water accessibility and increases land erosion. Within the overall system, this connection introduces a reinforcing behavior as poverty decreases water accessibility, leading to increased land erosion, decreasing food security, and finally reducing the level of poverty.


Solutions and problems

Expanding from here on, causal-loop diagrams prove helpful in analyzing possible solutions to the analyzed problem structure. Stakeholders can be asked to place 'solution variables' within the constructed CLD which, as they perceive, would prove helpful. Using the established CLD, these proposed solutions could be directly assessed in their impact on the overall system dynamics.


Responsive image

Problem variable definition

Responsive image

Inserting causes

Responsive image

Inserting consequences

Responsive image

Inserting feedbacks


Here we are with the CLD. In the center, the problem variable and structured to the sides: causes and consequences and their interconnections. Variables linked to symbolize causal relationships then emerge to a “causal network”. This structure helps us to explore interdepencies, self reinforcing or balancing dynamics and any other key causal processes causing and impacting the central variable and produce e.g. a problematic state. The science behind analyzing the dynamics in-depth is called system dynamics. Here, CLDs are one of the more intuitive ways to model complexity. System dynamics focus on system driven dynamics like vicious cycles. How a system might create a structure which traps people in poverty or even reinforces it? How and why does the problem state come about? This is one of the key questions a CLD can answer you. In that regard, the last step about adding solutions and problems becomes crucial. These allow you to assess how a particular solution or problem an interviewee suggests might influence the overall dynamics. Consider this example of a vicious cycle, visualized clearly by the CLD, from our case study on nomadic pastoralist livelihoods in Western Africa. Focusing on the poverty variable, which stakeholder brought up to measure the poverty level of nomads, we find it within a vicious cycle structure among with migration and conflicts. Imagine an initial increase in the levels of poverty (i.e. more severe poverty), the causal linkages to migration and conflicts imply an increase of those, too. Then, as these reconnect to poverty by causal links, poverty will increase even further. A vicious cycle (also reinforcing feedback loop). The same dynamics actually are true for a positive shift of less poverty within this limited model. As a contribution from the stakeholders, one might be interested in possible solutions to break negative vicious poverty circles here.


This section discusses practical subjects with respect to the interview process to design CLDs. While this cannot capture an entire guideline, we will discuss some issues from Jac Vennix. In 1996, he published the technique we discuss here to design CLDs within an individual interview process. The select of these ideas does not deemp any other journalistic guidelines irrelevant.

  • Asking the right questions: Vennix stresses to think about purpose and the sort of questions to be asked before the actual interview. In the interview, first state the purpose, and the objectives. Also, as a motivation to the interviewee. During the interview in particular, answers are discussed to be more meaningful if the interviewee is aware of the context of the interview and why the CLD is constructed.

  • Probably even more stressed in science, is not to influence the interviewee by the phrasing of questions. In particular for the creation of CLDs, we desire the interviewee to come up herself with variables and links. Instead of asking “do you think flooding has a impact on soil erosion”, consider “what do you think influences soil erosion”. E.g. to ask for causing variables of soil erosion…

  • Vennix stresses the importance of singular questions. One question at a time. Multiple questions might rather create confusion or leaves things unanswered.

  • These key ideas can be summarized as: open ended, singular, neutral, clear, concerning the questions to ask

  • Kahn and Kanell (1957) describe the interaction of interviewer and interviewee as “an interaction between the interviewer and respondent in which both participants share”. They stress how both interviewer and interviewee contribute to the results. To elicit important information there is a high degree of responsibility on the interviewer to contribute a quality to the interview. To do so, it is crucial to clearly state the purpose of the interview, offer a clear understanding of the method and create an open and integrative environment within the interview situation.

The Participatory Modelling in Science and Journalism

Up until this point, we showed and discussed the capabilities of CLDs in explicitly displaying complex problems and underlying causal structures. Participatory Modelling, as we will describe within the following sections, uses these for interacting and documenting the perspectives and knowledge of relevant actors (stakeholders) to a messy problem. To gain a holistic perspective of a messy problem involving multiple stakeholders, single CLDs will not lead us far. Instead, participatory modeling describes an entire process: identifying relevant stakeholders to participate, constructing CLD with these stakeholders, and aggregating these individual CLDs to map a holistic understanding.
Expand the box below to find both a detailed perspective on the academic participatory modeling process and how we vision a transfer to journalistic work.

The academic approach

Participatory modeling exists within various variations. Nevertheless, all designs have in common the integration of stakeholders, their knowledge, and perspectives. Given the variety of cases studied, each case might display different circumstances and constraints that a participatory modeling design needs to be adapted to. For example, CLDs can be created either in individual-level interviews or within groups. Concerning the group-level though, existing power-hierarchies among stakeholders has been shown to decrease the participation of lower-hierarchy stakeholders. The approach we present takes this into account as it is based on individual-level interviews.


Who is involved

The high value placed on including diverse stakeholders stresses the importance of the selection of stakeholders. Analyzing stakeholders involves detecting and categorizing actors that hold a stake in the relevant system. In the DAFNE project, stakeholders are defined as “anyone who has an interest or stake in the project process or result or holds the ability to influence the outcome of the project” (van Bers 2018: 4). Criteria to select stakeholders could be the type of stakeholder, their scale, sector, function, interest, expertise, resources, and level of engagement.


Individual CLD construction

The selected stakeholders are then to be invited to interviews to construct a CLD, mapping their perspective, applying the process described within the previous section.


Aggregate

A set of individual-level CLDs might cause more confusion than offer a helpful tool. Thus, these need to be aggregated in a meaningful way. A resulting merged CLD offers a holistic perspective that can be used to analyze the system´s features and characteristics. Also, it systematically reveals differences in the structure of CLDs from different stakeholders. It helps to estimate the boundaries of a problem by integrating variables relevant to a diverse set of stakeholders. To merge individual-level CLDs into one aggregated model, we propose following the approach presented by Inam et al. (2015). The process is in detail explained here. As a result of this merging process, a merged CLD is created which contains all variables and links from the individual CLDs.


A Vision for Journalism

The scientific process of participatory modeling displays similarities to journalistic practices. What sets scientific participatory modeling apart, is the systematic approach to mapping actor's perspectives, combing and analyzing them to understand a messy problem structure. That in particular is what we believe to advance journalism both in tackling complexity and telling stories about it. We recognize that such a process, especially given the time resources, is often not compatible with a newsroom-daily routine. Nevertheless, for larger, more complex stories, we see the advantages of assessing complexity and related intuitive storytelling. In practice, this process would be close to the scientific context. Researching involved actors, individual- or group interviews to construct CLDs, aggregating these, and communicating results in a journalistic way. The latter step is where the journalistic- and scientific-approaches differ most. While scientific reporting is focused on the scientific community's "constraints", journalism can take advantage of digital-platforms and visualization technique, to create interactive, intuitive storytelling forms using CLDs. Below, we discuss the storytelling approach in more detail.

CLD driven storytelling

The capabilities and features of digital platforms for visual storytelling and interactivity are highly suitable to communicate and disentangle a CLD's complexity.
A story, such as resource scarcity and connected social issues in the Omo-Turkana-Basin, includes a variety of stakeholders, with different interests far beyond what has been scribed here. Overall, the research's resulting aggregated causal loop diagram held more than 80 variables. In text-form, the entailed complexity would be almost impossible to reasonably communicate to a reader. During research on the DAFNE project, we experienced the intuitive nature of CLDs in communicating research results and problem structures.
Why not exploit the capabilities of CLDs, expand, using the capabilities of web visualization and interactivity, and tell stories? Expand the box below to see how we imagine this in practice.

Responsive image

Principles for communicating CLDs

Stepwise storytelling

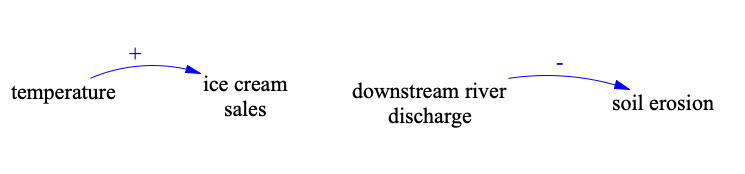
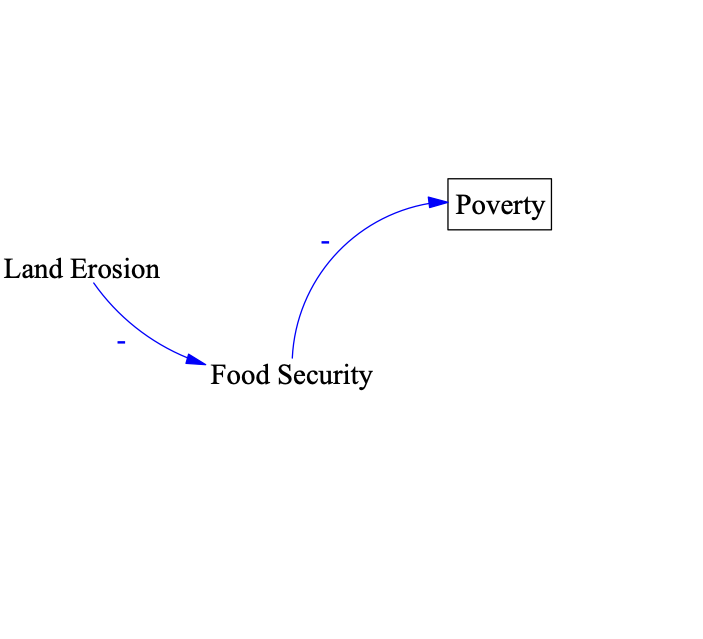
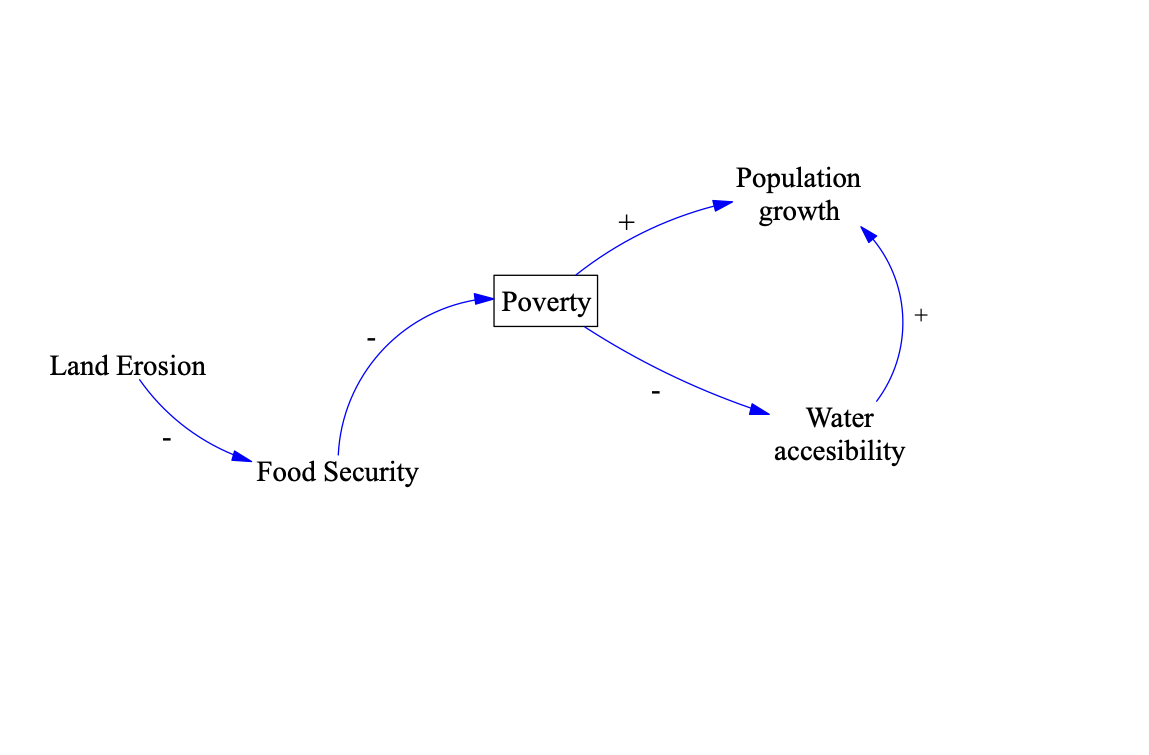
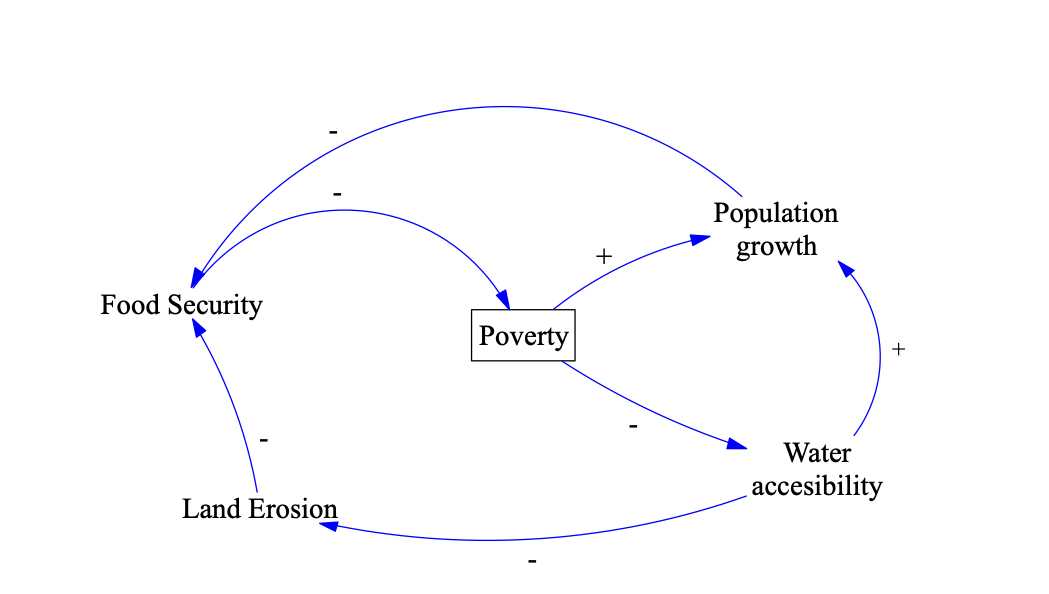
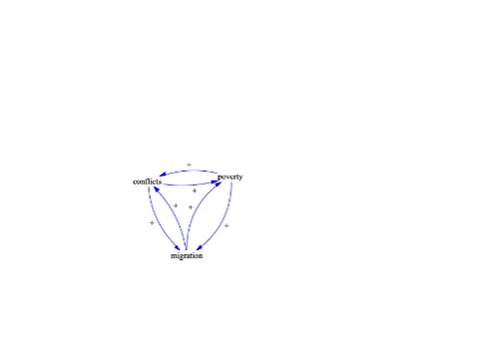
The final, complex network-structure displayed by a CLD does not just appear out of the abyss. Closer to reality, a CLD is developed within an iterative process of adding variables and links step by step. Similarly, a CLD should be communicated. Start with the central variable and explain the involved complexity step by step by including more variables. Don´t confront the reader with the full picture at the very beginning. A dynamic unfolding of the CLD, as depicted in the animation above, is more meaningful to understand the story behind the nodes and links.

Links are more than binary

Even though the CLD simplifies causal relationships to a binary level, that should not limit the storytelling to the same level. Some links might hold insecurities, ambiguities, or disagreement. Thus, provide further information for links. Use them as interactive items to display further information as the reader clicks on them.

Disagreement to the front

An essential part of participatory modeling is the integration of diverse perspectives. Diverse, and probably disagreeing perspectives need to find a special place in the storytelling. One of the strengths of participatory modeling is to systematically map disagreement of stakeholders concerning the messy problem in place. This comes to hold relevance in the aggregated CLD which points differences out explicitly. For storytelling, the aggregated model can be used to highlight disagreement. The network structure than allows a reader to quickly assess the consequences.

System Dynamics

The simple CLD structure allows creating drawbacks to the overall behavior of a system. In which direction is it heading, what are the key reasons for, and what are its consequences? Good CLD-driven storytelling communicates these insights and makes them highly visible.

Interactivity and additonal information

The advantages of digital platforms allow high levels of interactivity features for the reader to investigate the CLDs by herself.

Web-developer?

We are soon starting development on an open-source web-framework to enable CLD-driven storytelling. If you want to support the development and are capable of web-development please get in touch with us. Within this project, we would like to enable all the principles described above to enable high-quality storytelling.

Getting into practice with us


Pilot Project

We are highly interested in working on pilot projects, applying participatory modelling journalism in practice. Do you share that interest with us and are open to a new approach? Let us know!

Send an e-mail
Web Developer

You´re a web developer? Perfect, help us develping an open-source framework for digital story-telling using causal-loop-diagrams.

Send an e-mail
Advice and Questions

Did we forget to mention anything important? Or are there other questions? Please do not hestitate to ask!

Send an e-mail